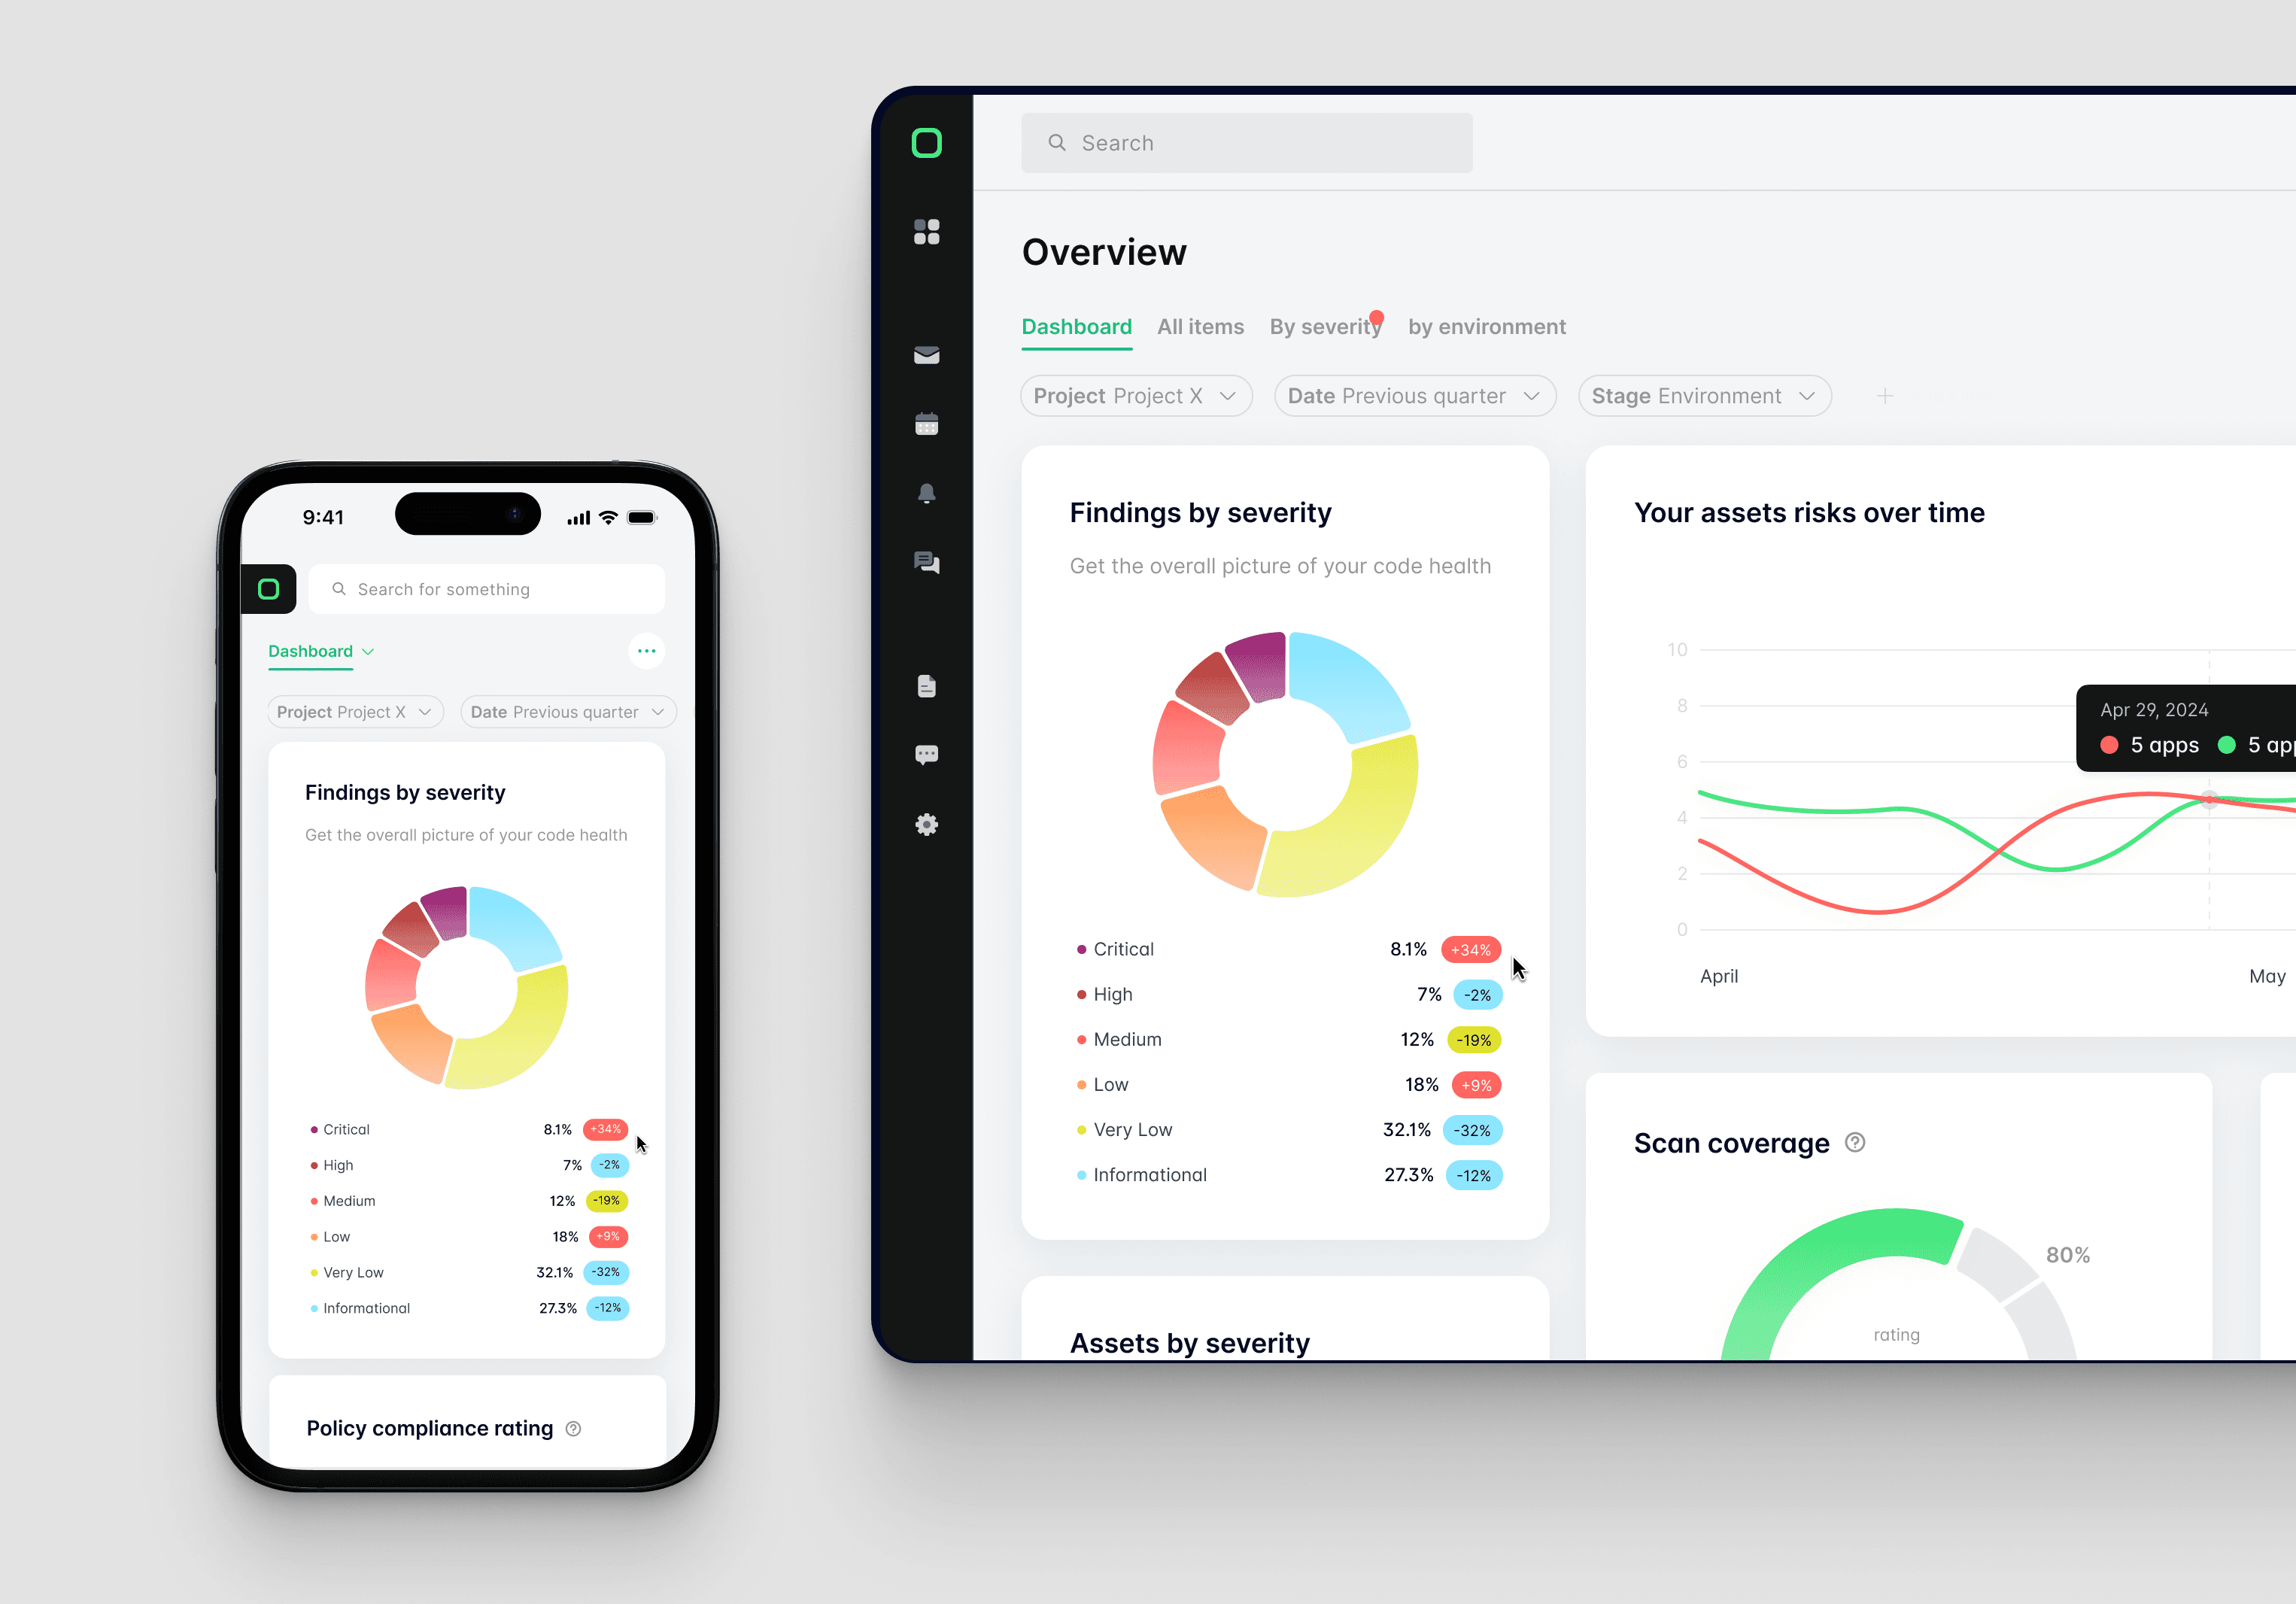
Our client, a leader in software security, needed a streamlined, user-friendly design to simplify complex data for security managers. This project aimed to make data accessible, with a focus on clarity, usability, and aesthetic appeal.
Client
American software company
NDA enterprise
Date
2024
Services
UI/UX Product Design
UX Strategy
Industry
Tech & AI

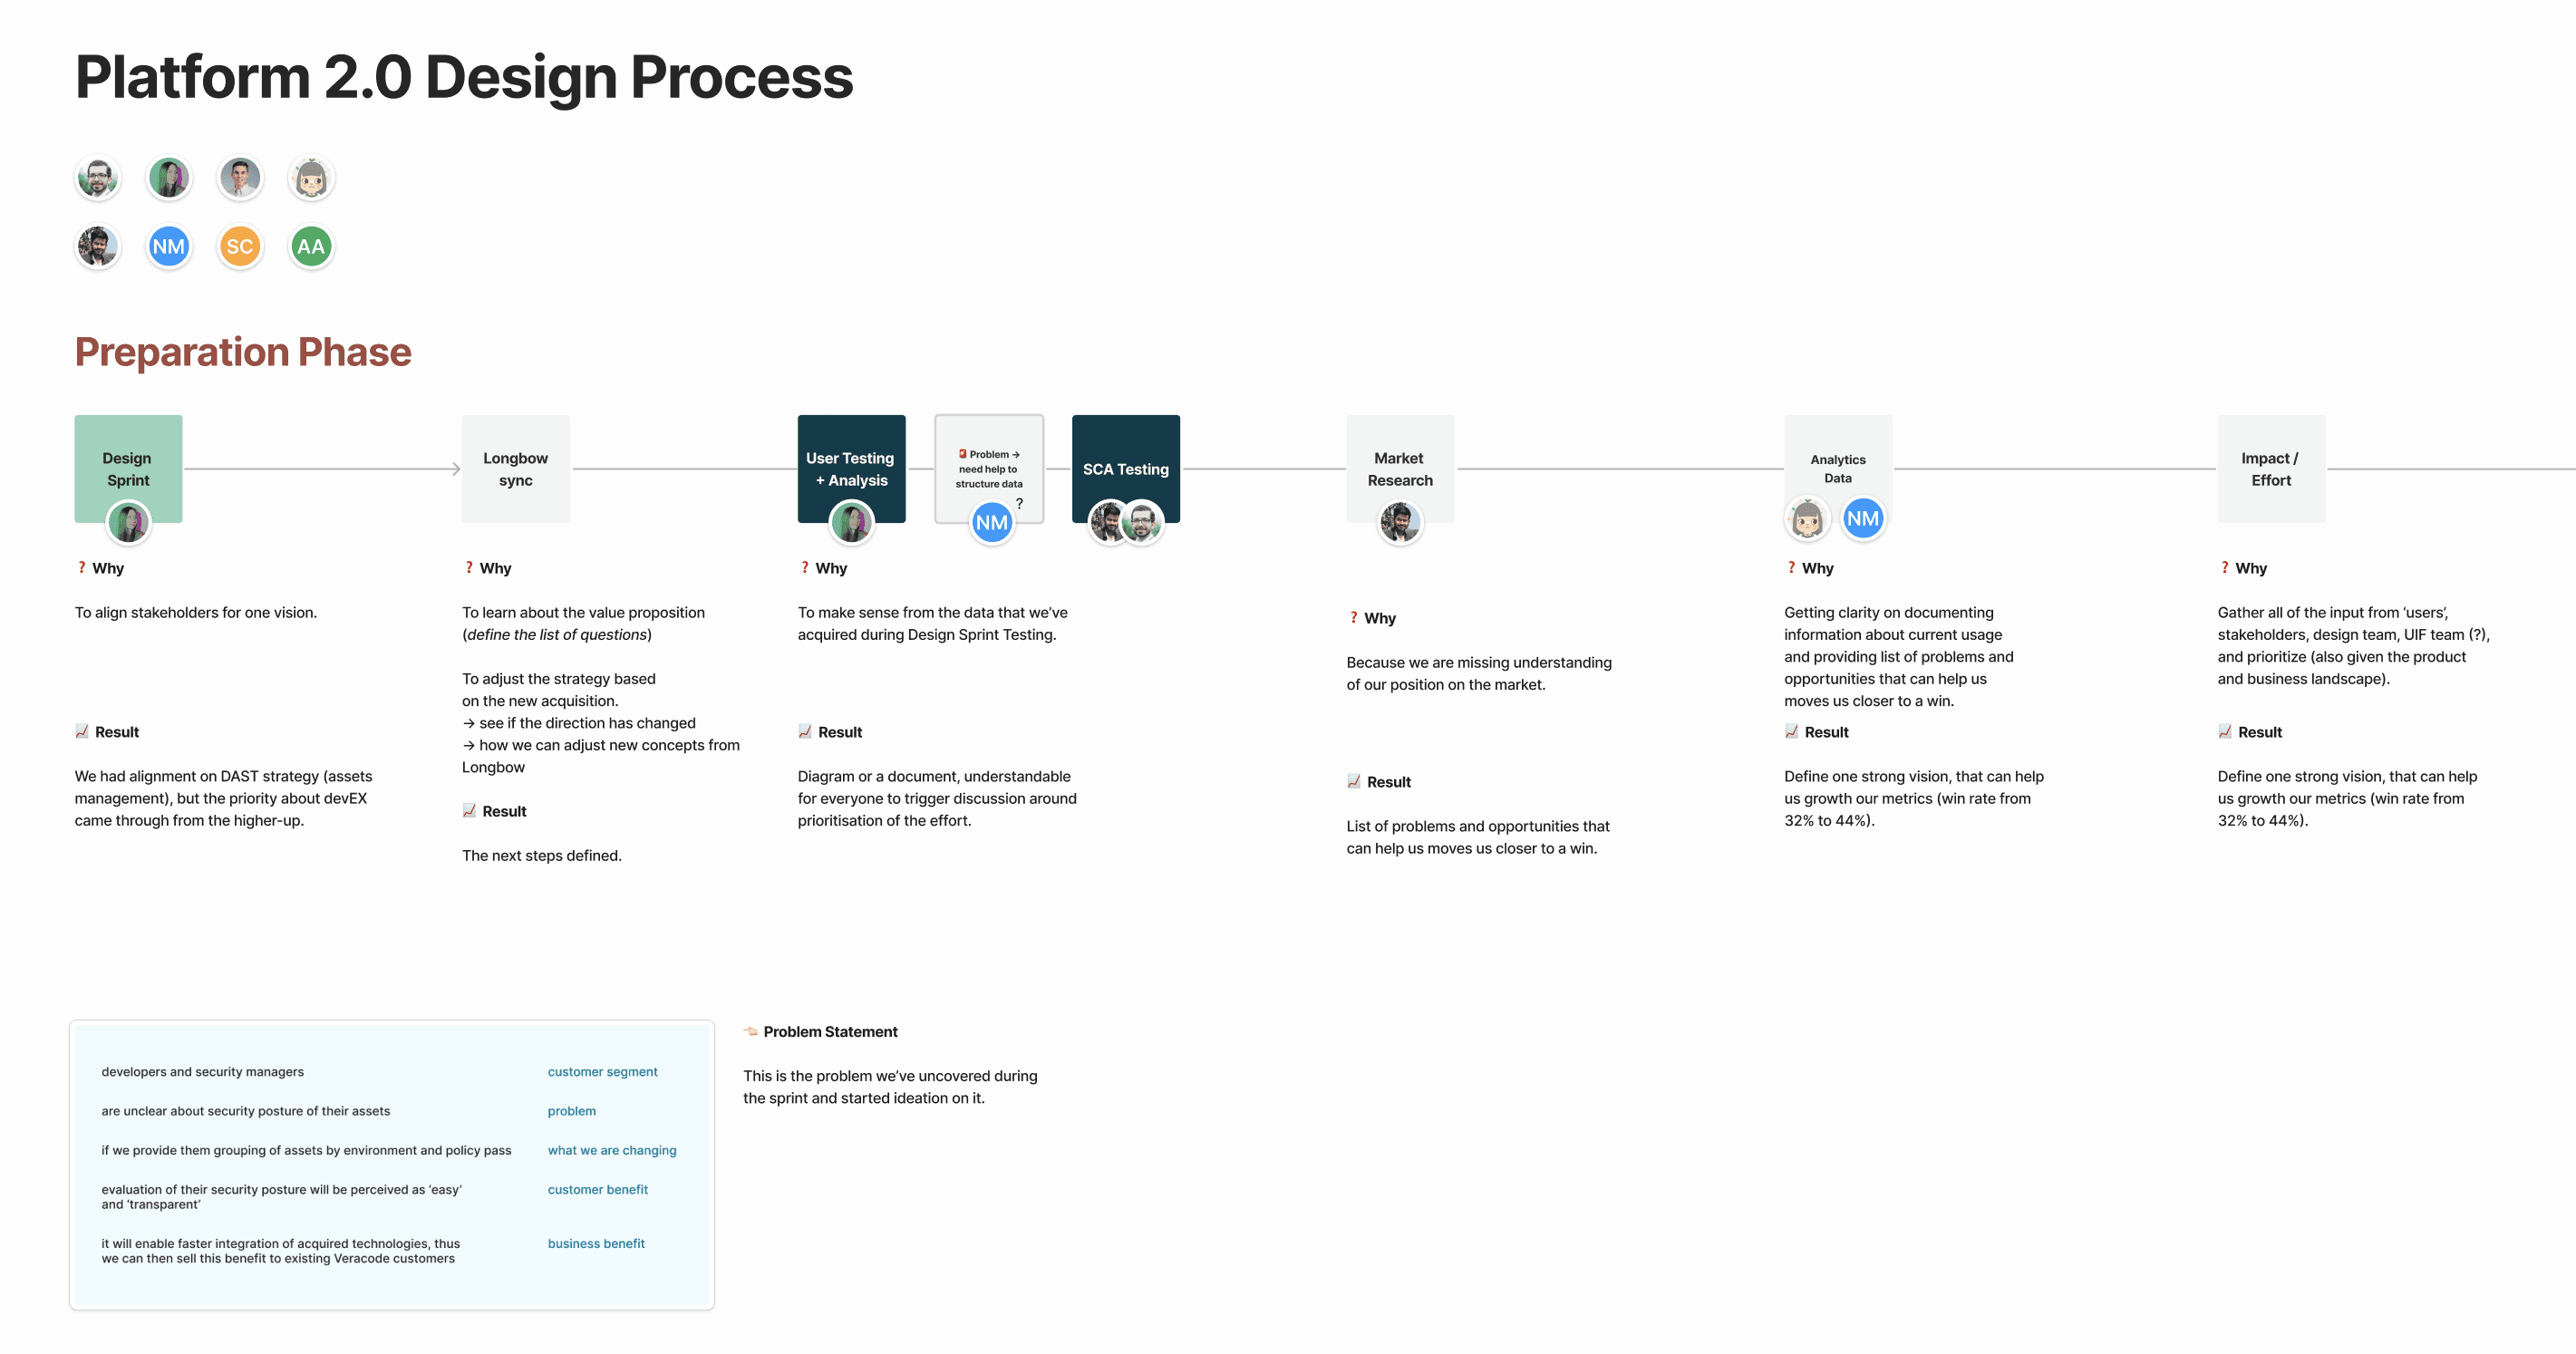

Design Sprint
To craft ideal user journey, prioritize features and empathize with a user more, me and Product Team decided to work together in a Design Sprint format, exploring major pain points and generating solutions.

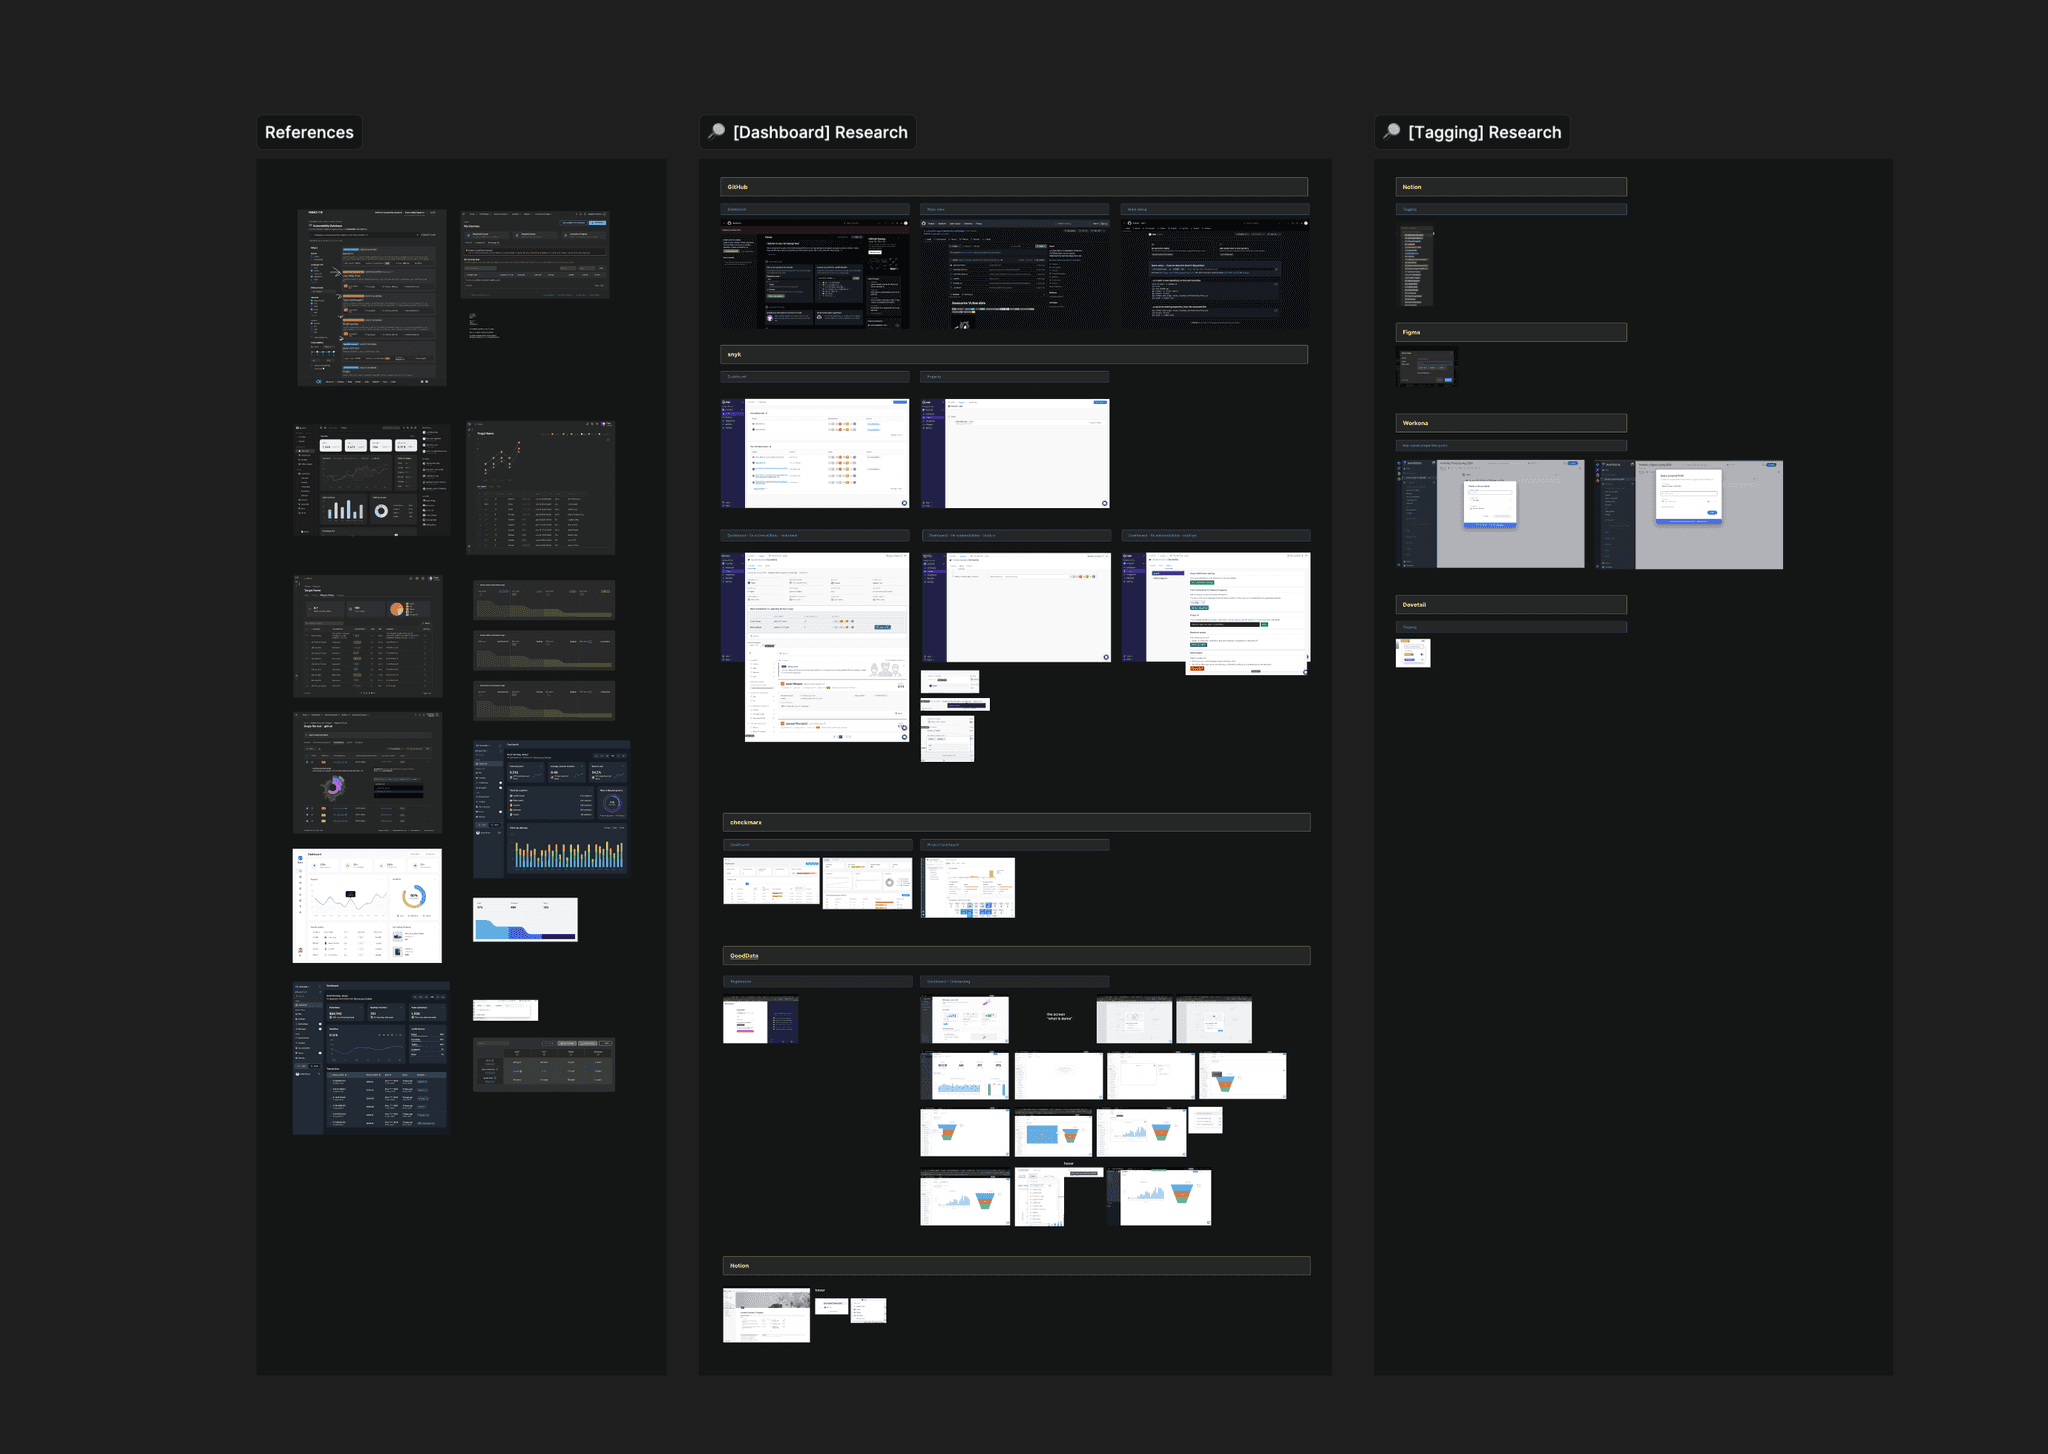
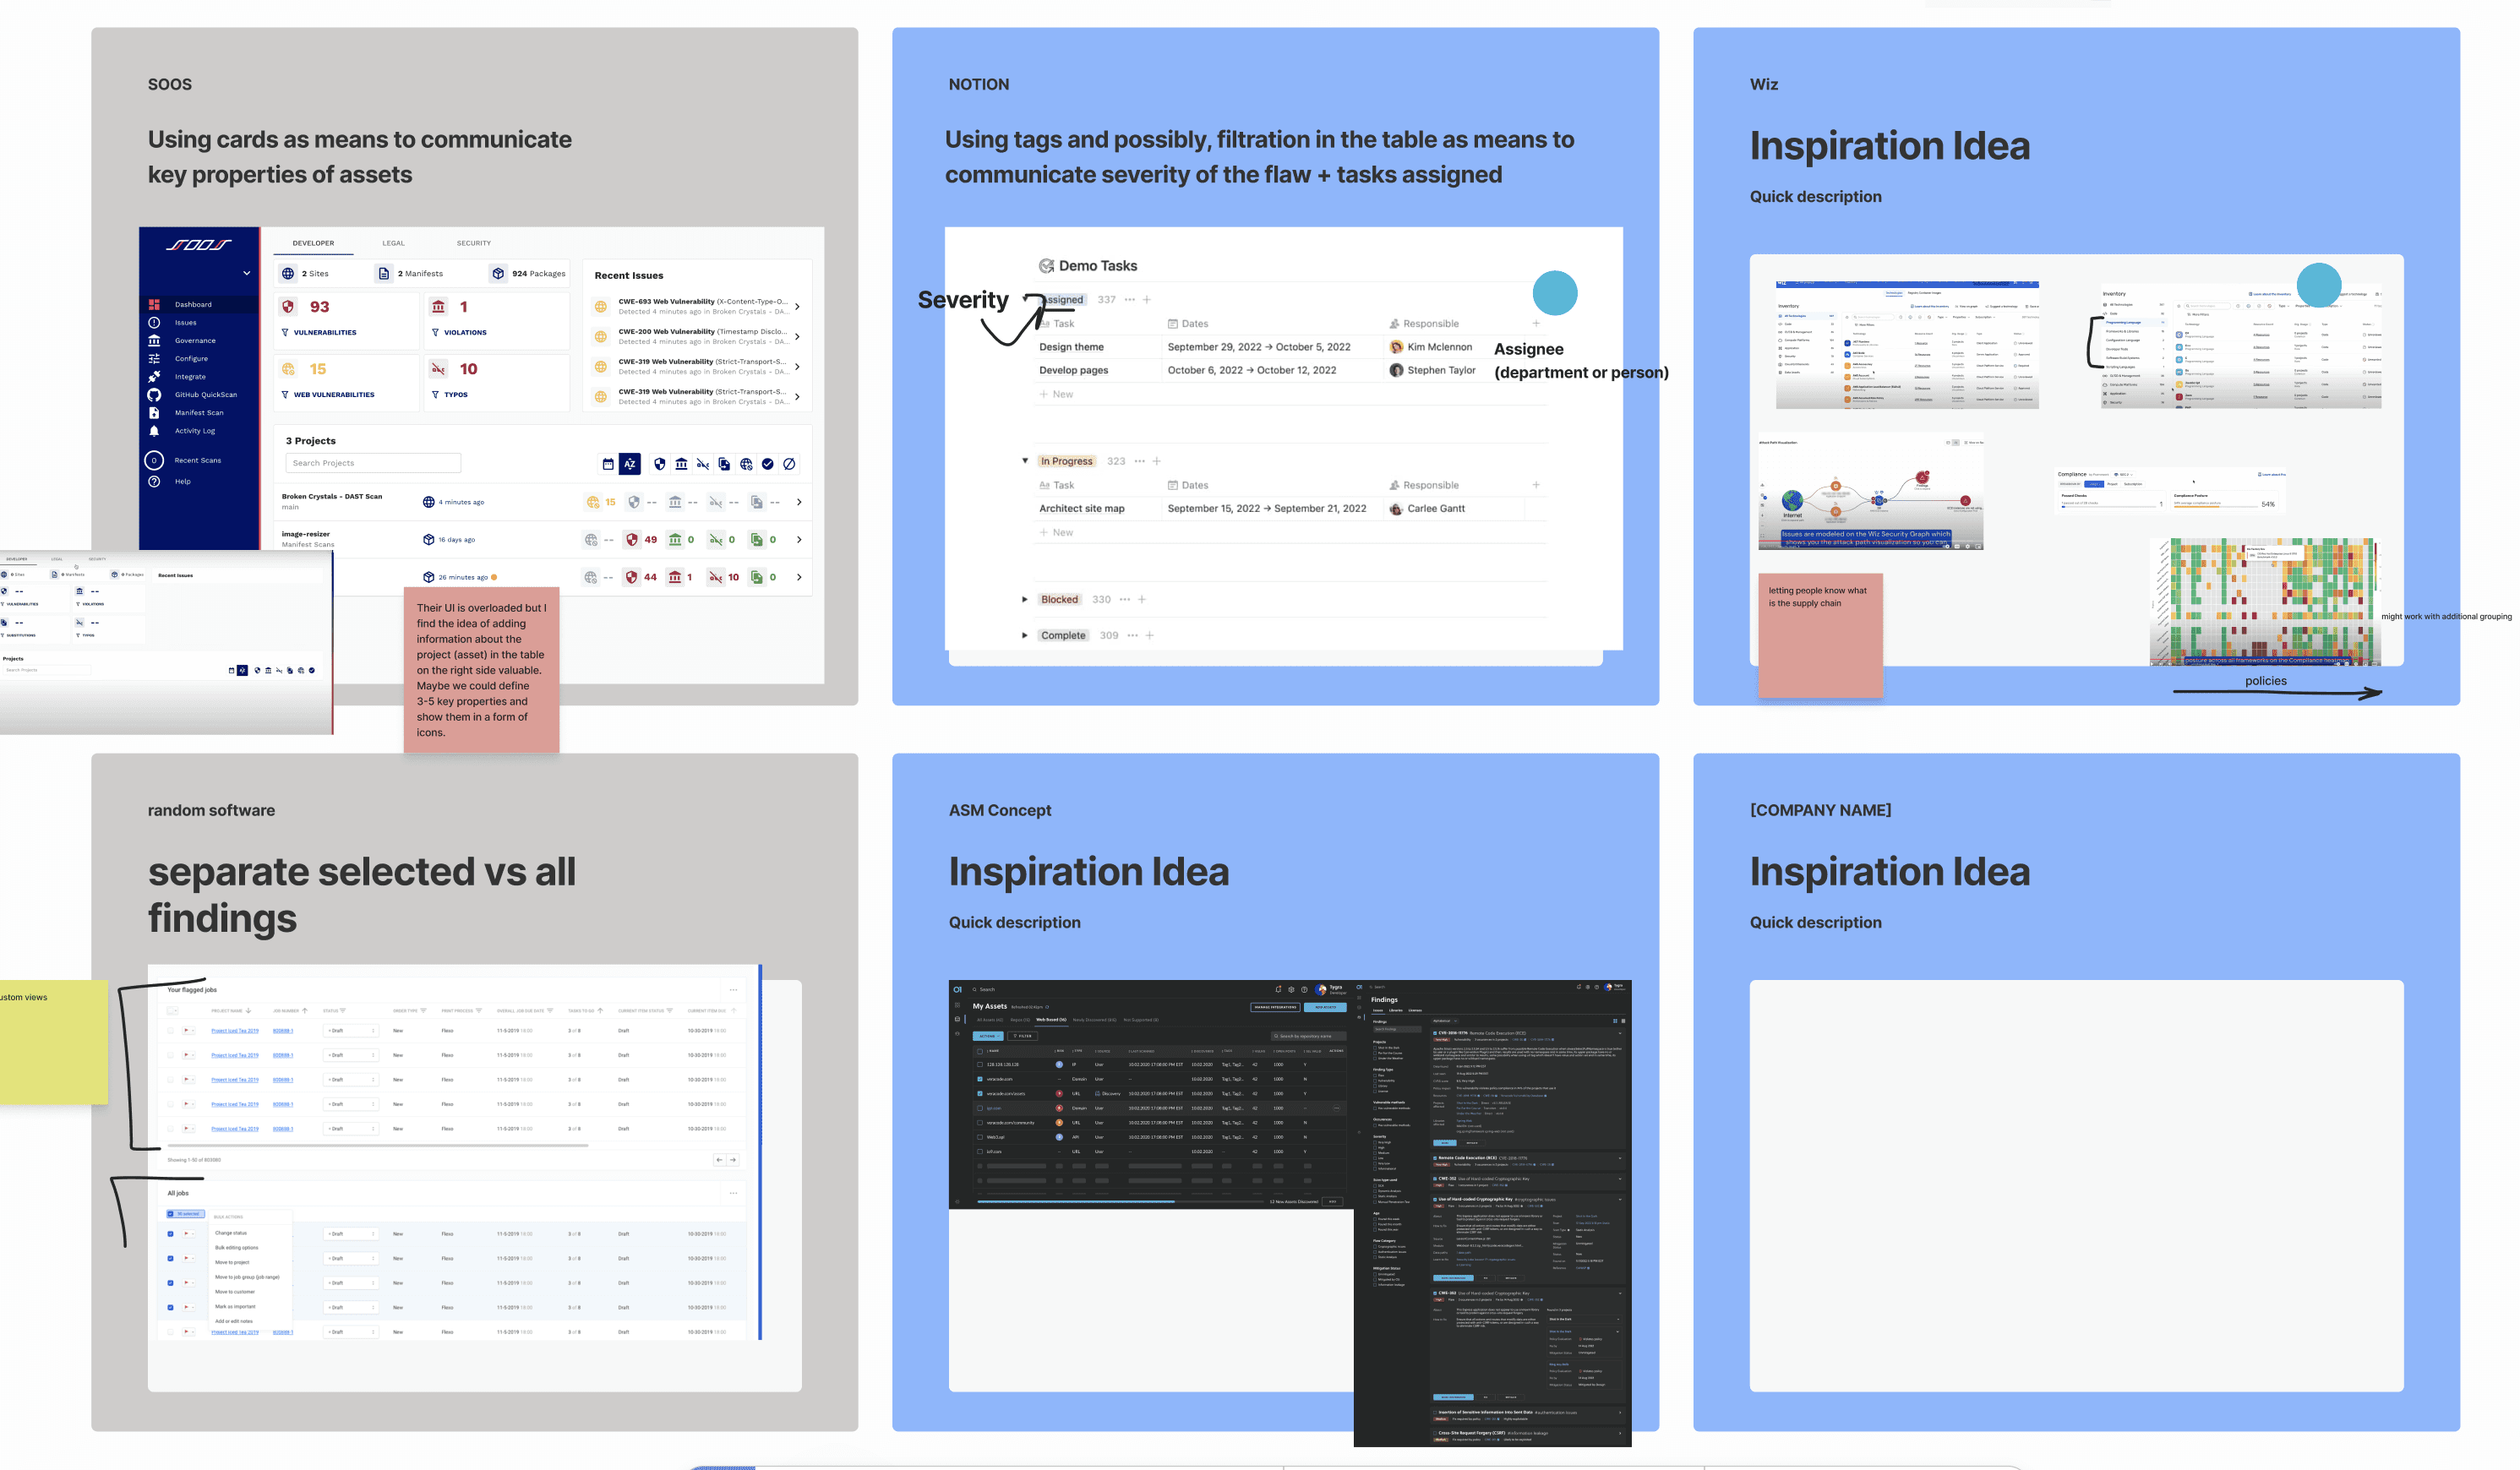
Competitiors Research
In hopes to answer a call of 'HMW help our users to understand which findings to focus on and get our findings to a coherent and understandable list of tasks in the platform or a backlog on a customer side?', me and a product team done extensive competitors research. We uncovered that startups in software security field are providing easy-to-use naigation, using cards and drawers.
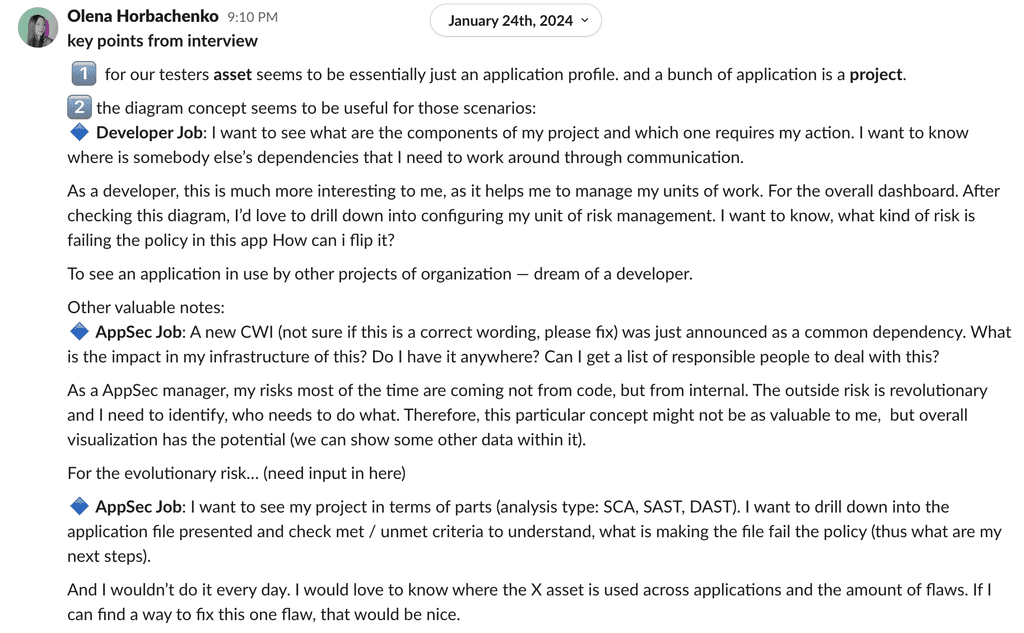
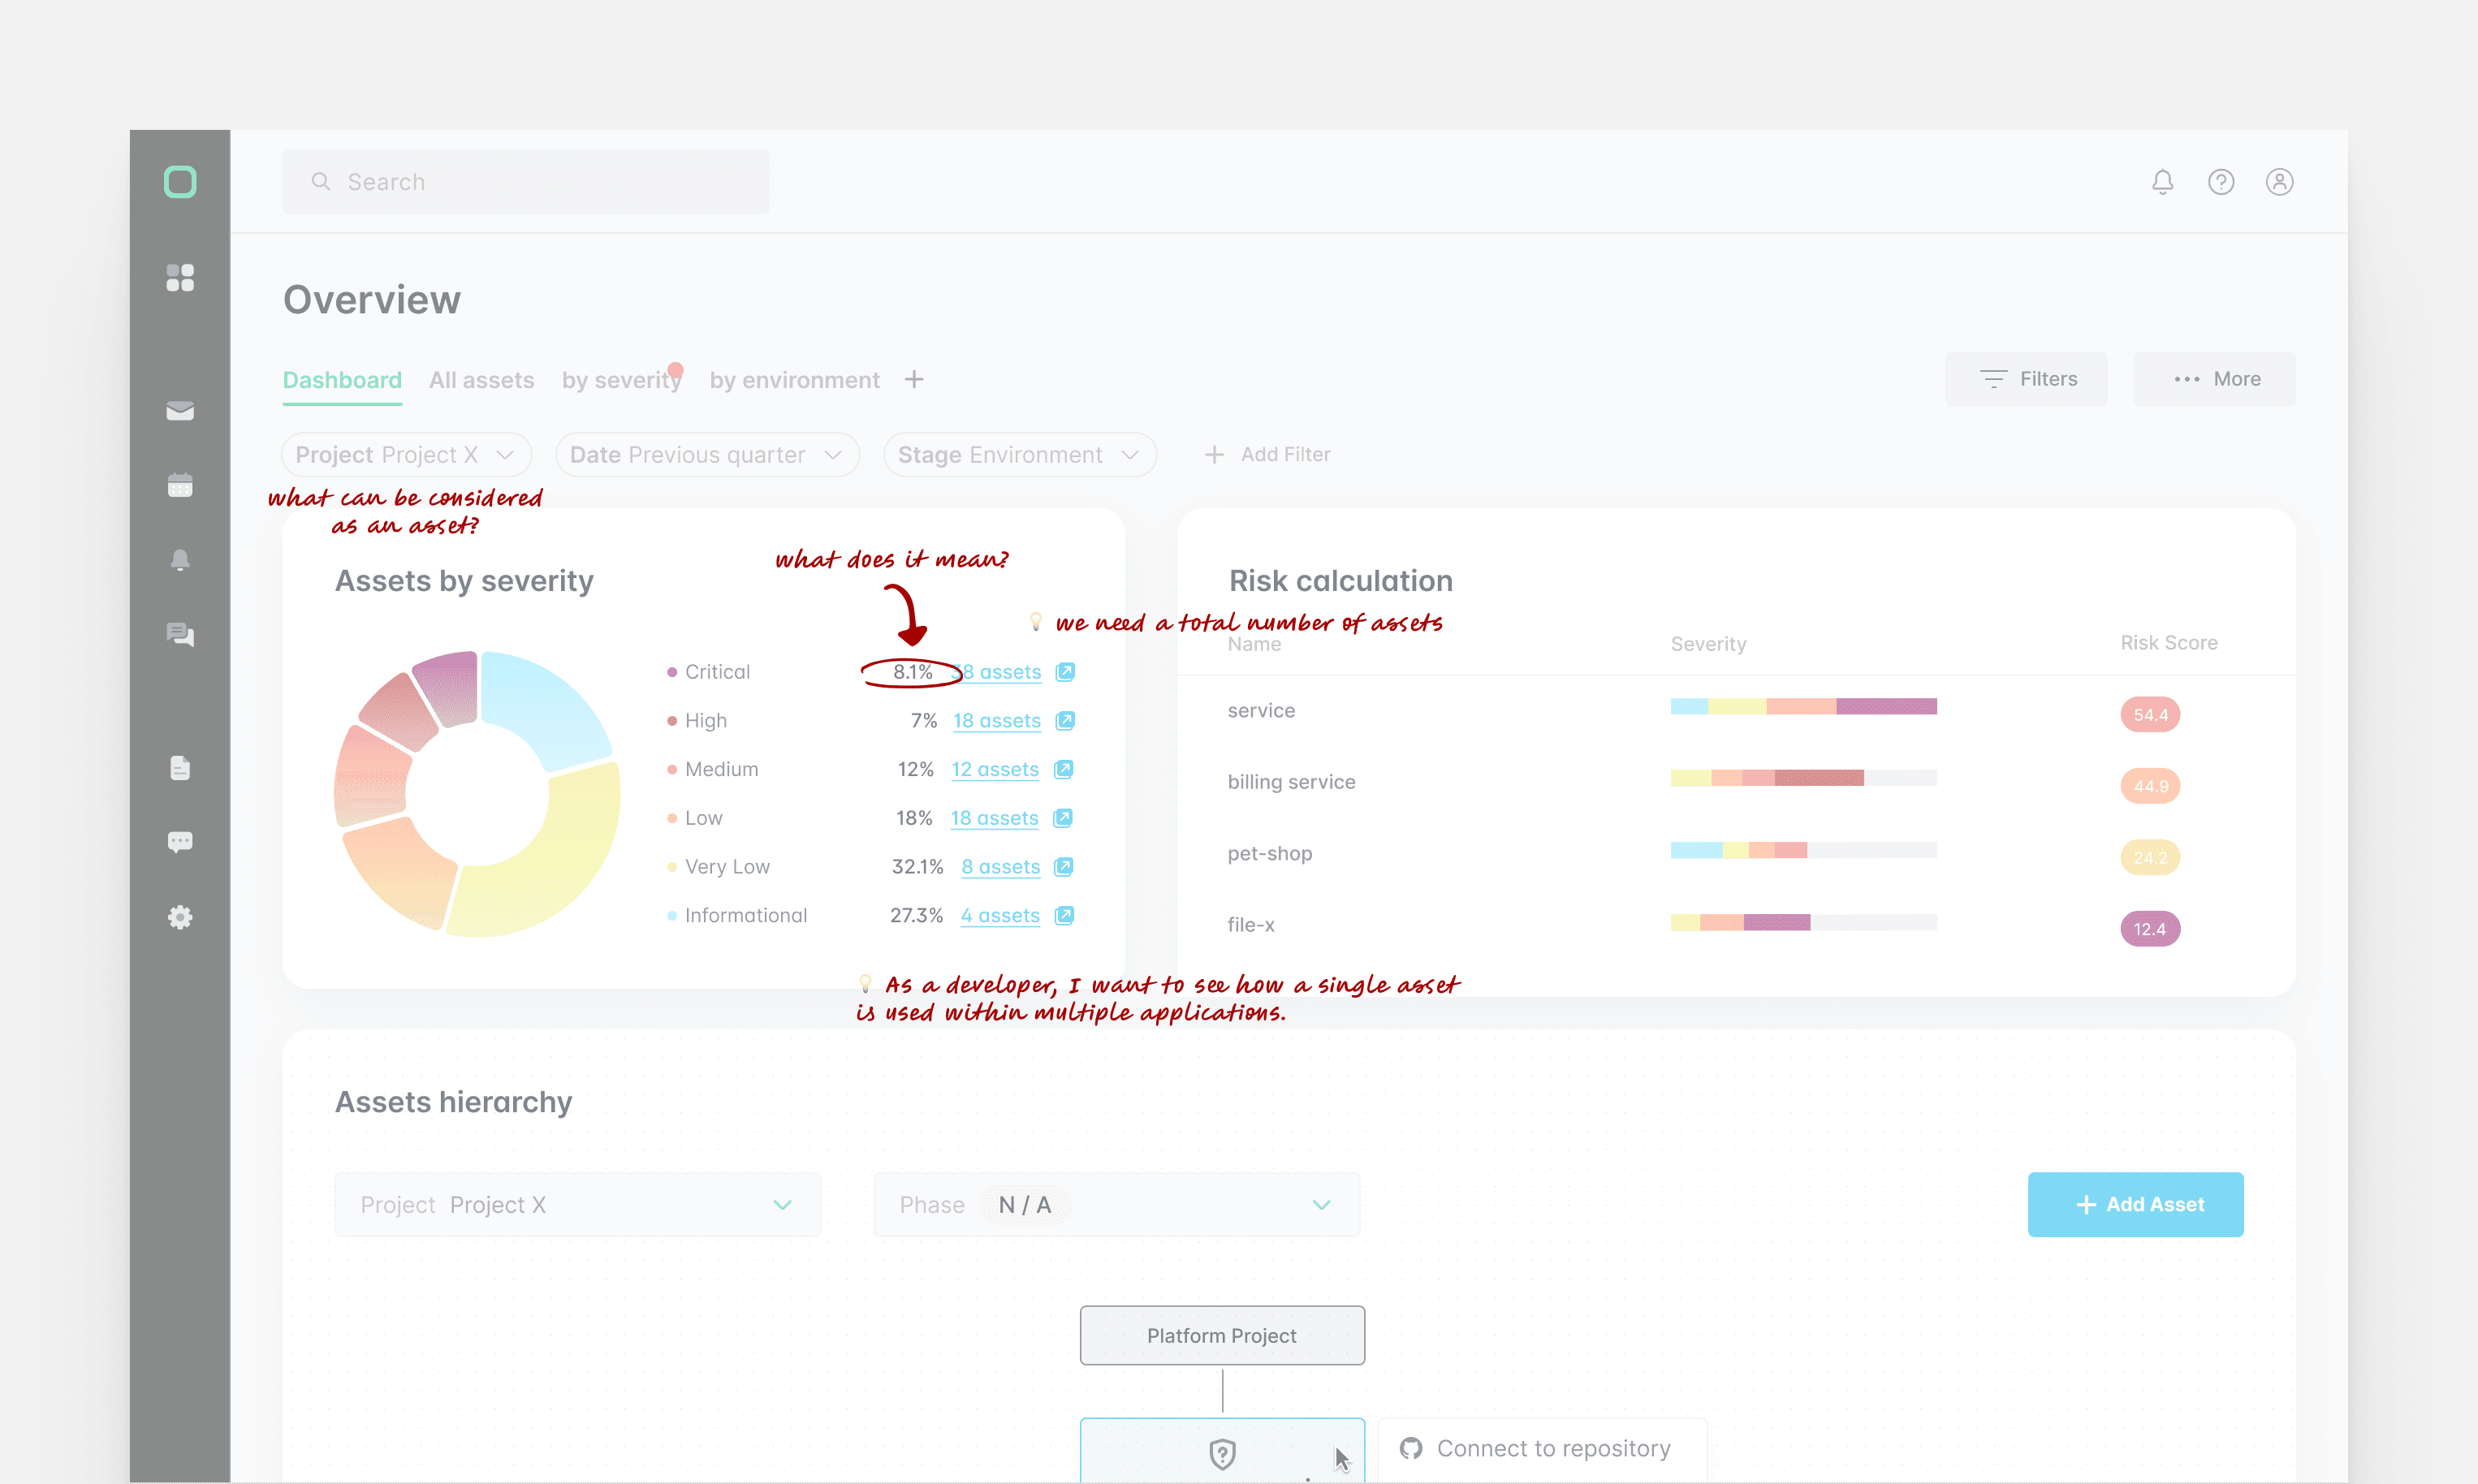
User Testing
After interviewing 5 Application Security Managers, we uncovered issues in namings, hierarchy and prioritization of widgets, and illogical points in structure of the asset - collection - portfolio segregation.
AI intergation
for data analysis
Design Sprint
conducted within a product team
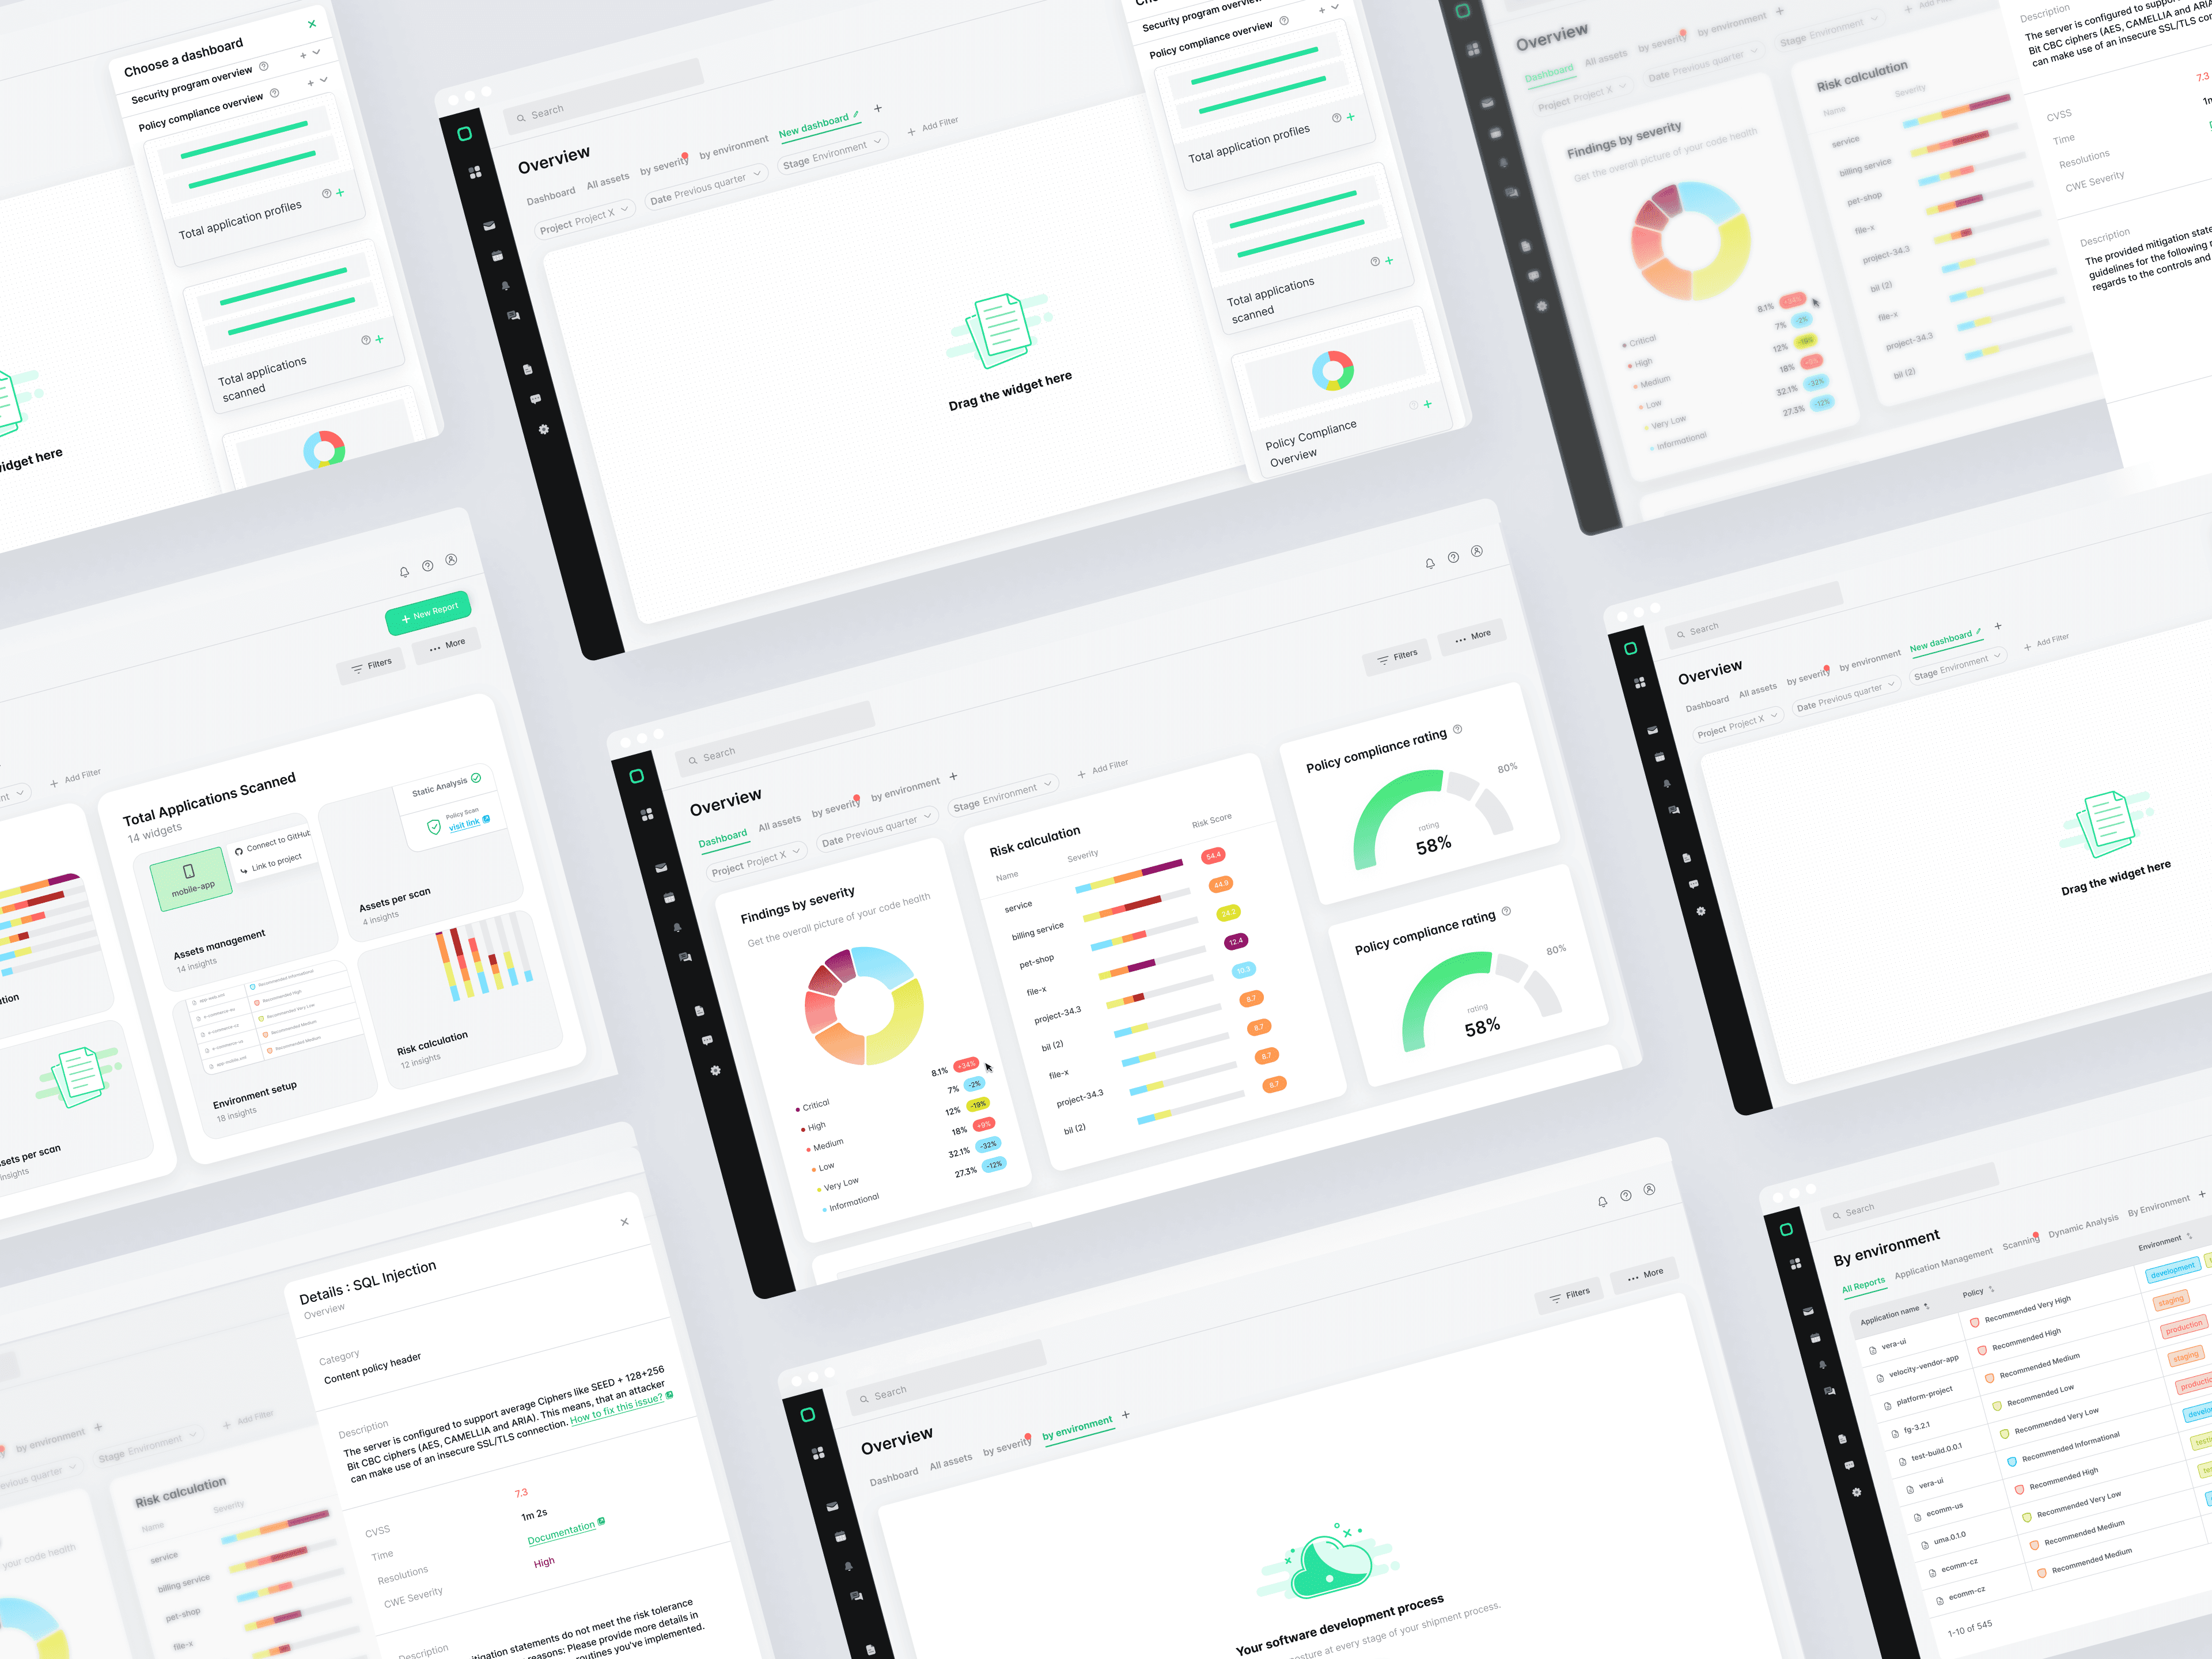
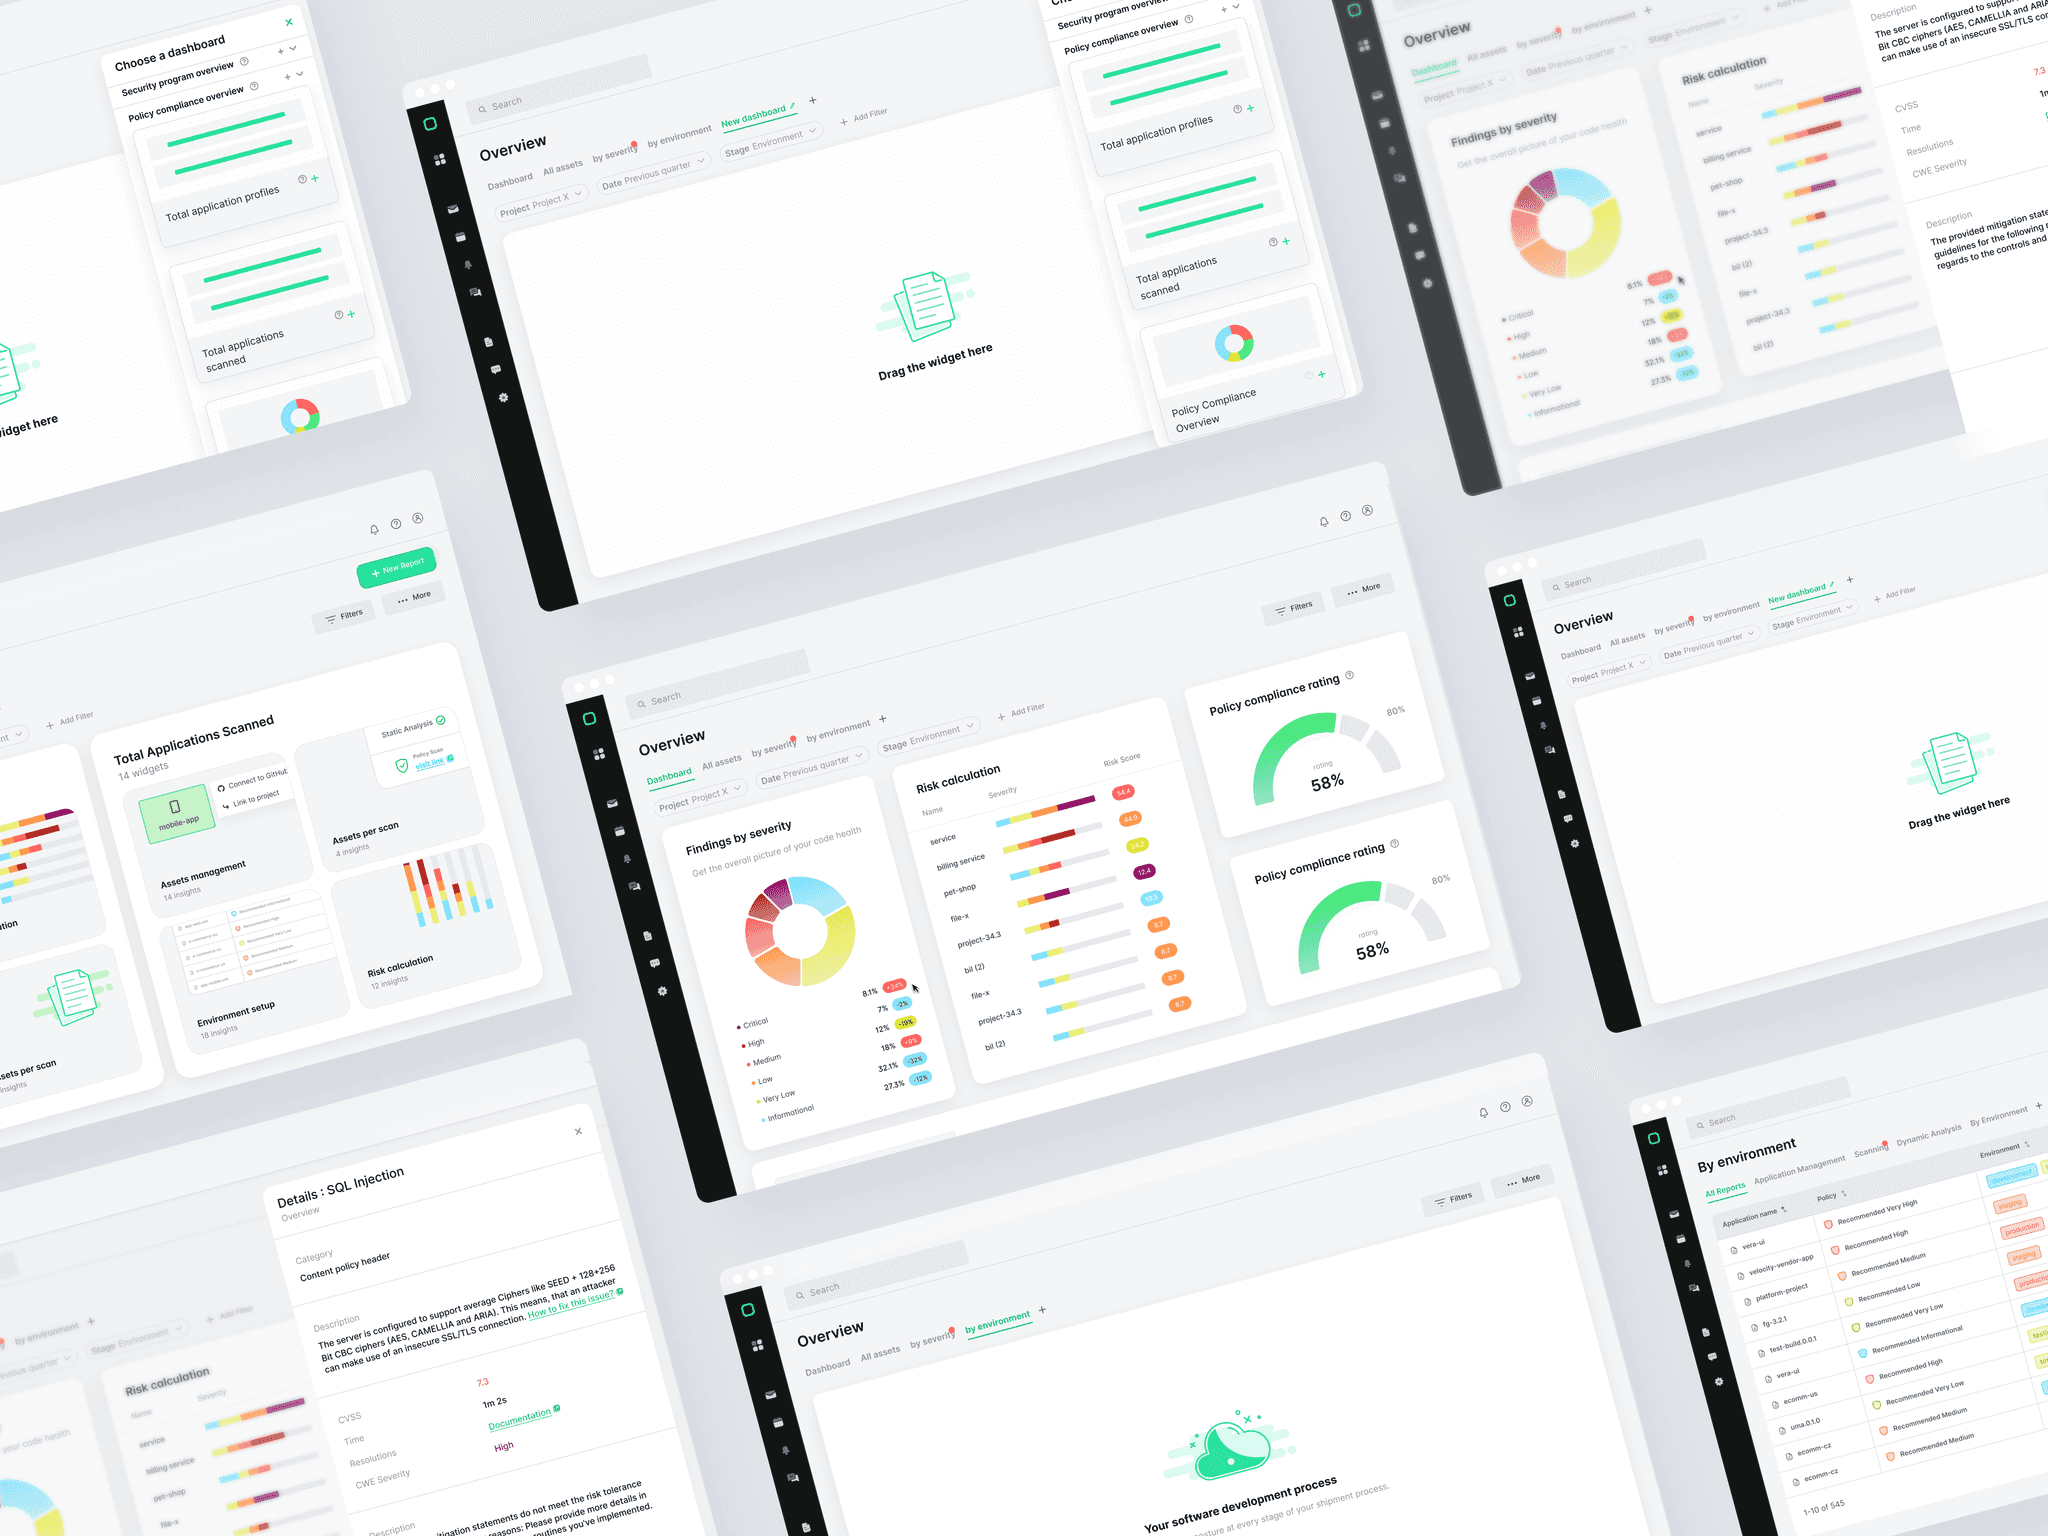
Result
The redesigned interface improved data engagement by 40% and significantly reduced user frustration, turning data into an accessible, visually engaging experience.
Impact
+40% of NPS score
analytics usage increased by +20%
Next steps
Launching NPS for measuring the impact of the analytics improvements.